Dashboard
The OCMP dashboard is the central entry page of the platform. It provides a quick overview of all relevant activities, campaigns, and key figures and serves as the starting point for further navigation.
After logging in, you get a condensed view of the current status of your environment, from running campaigns to usage and performance data.
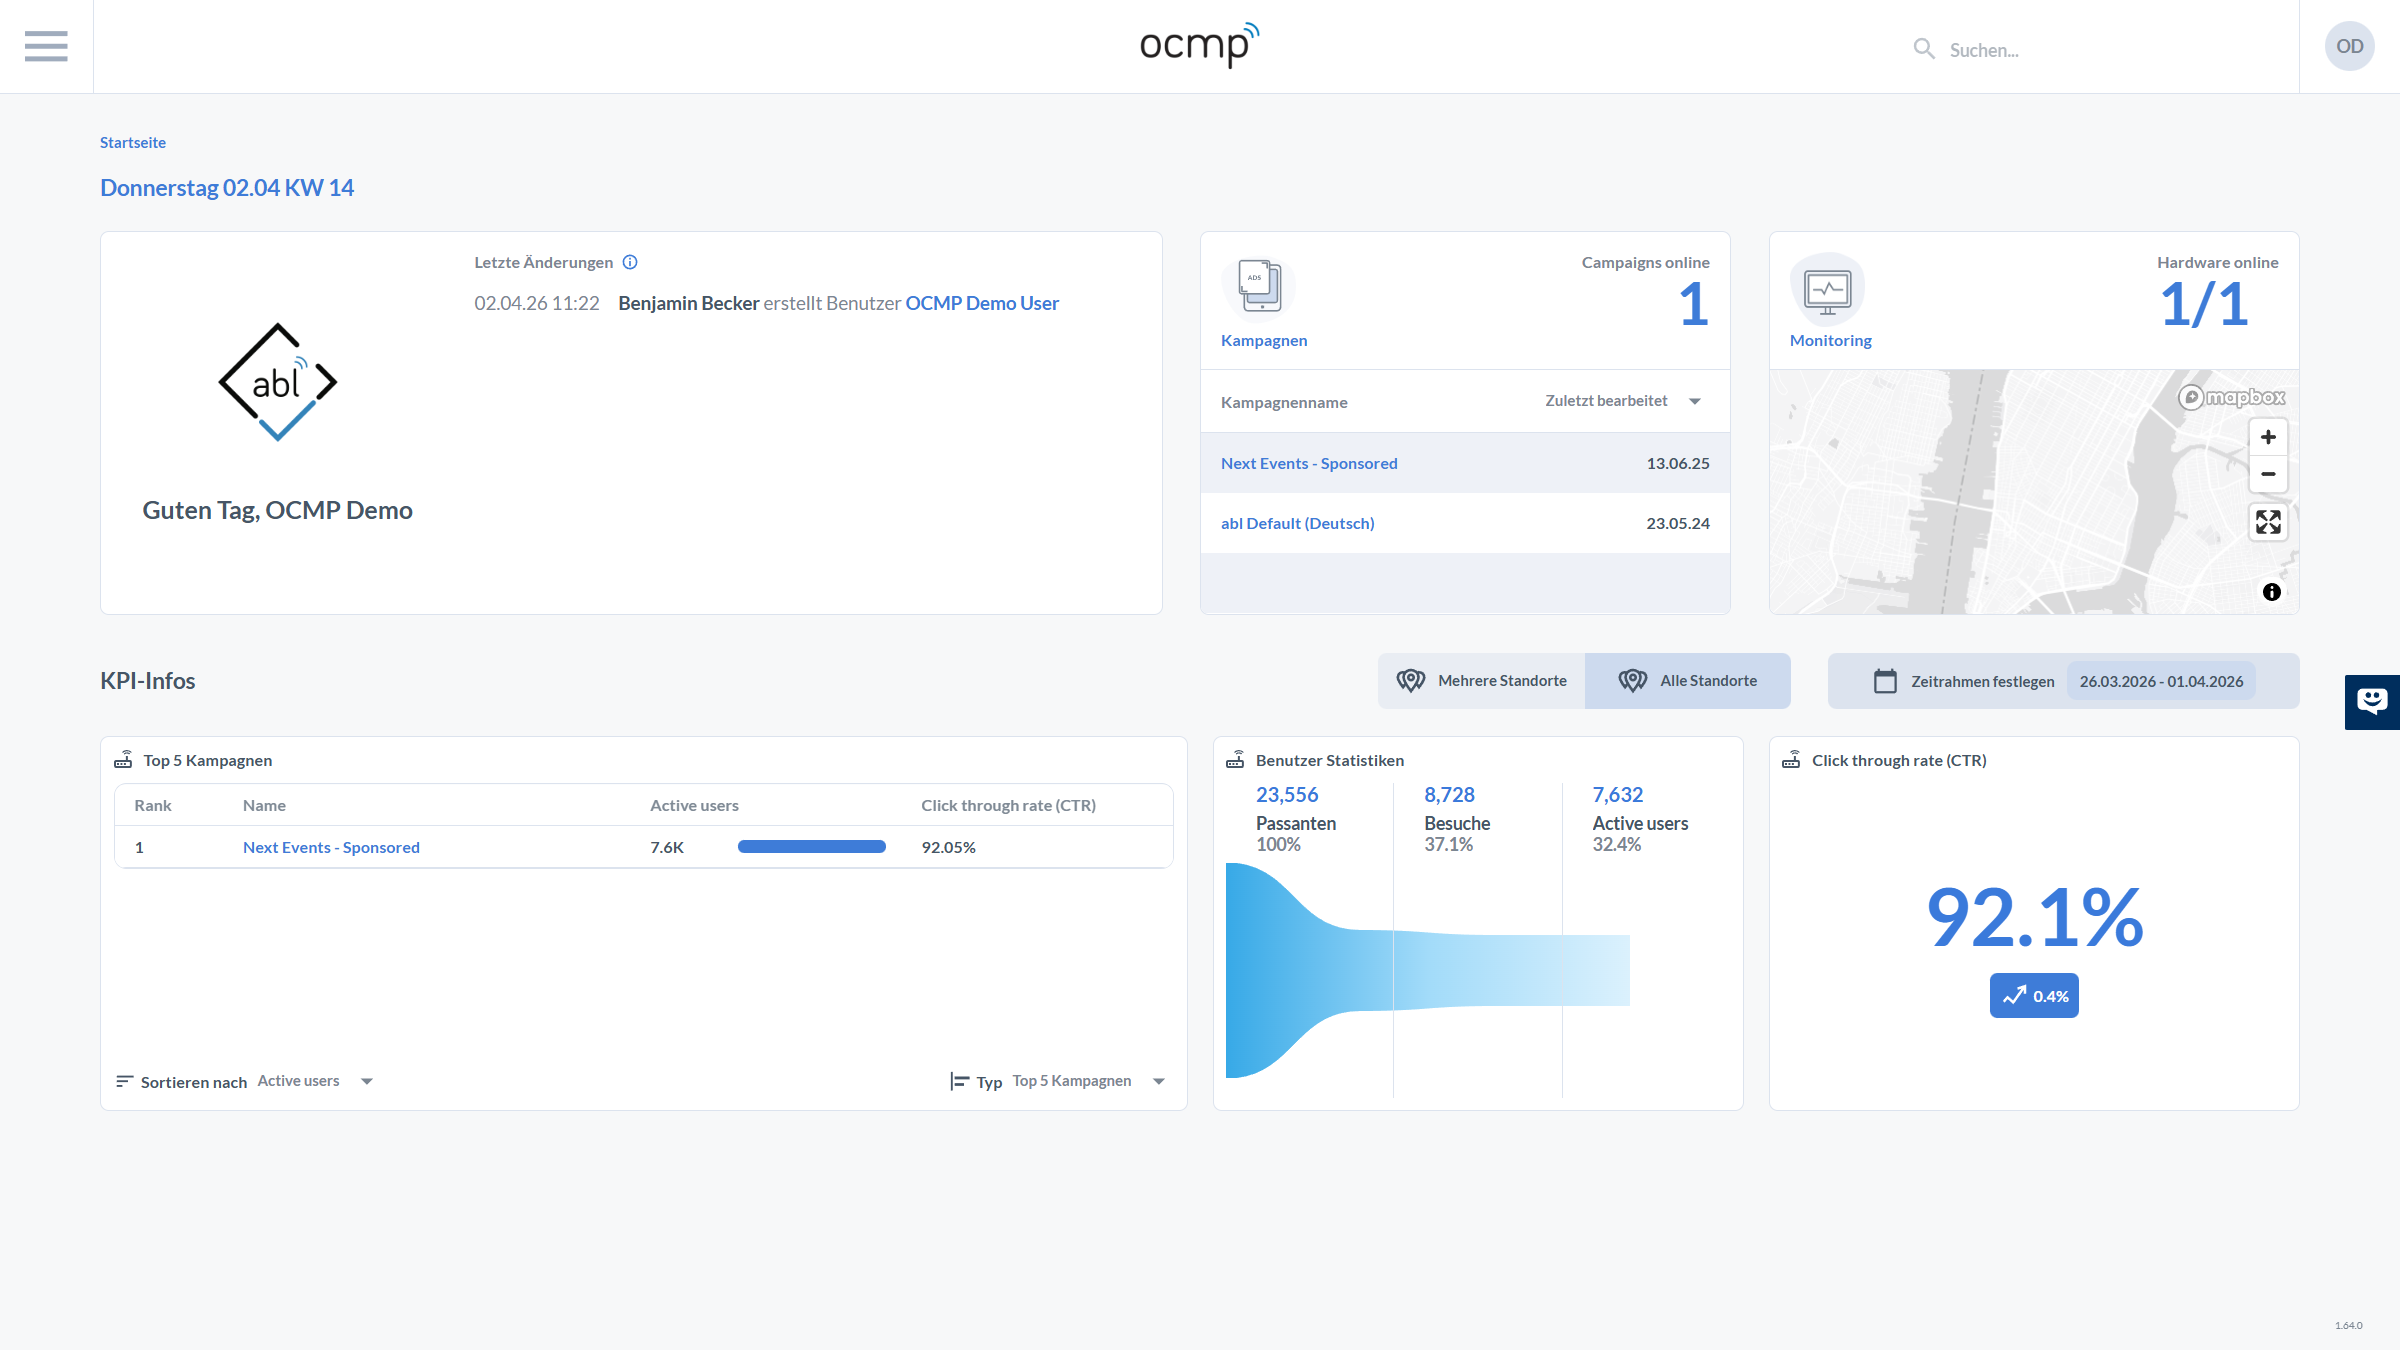
Welcome and Activity Area
In the upper-left area, you are greeted personally. In addition, the latest changes within the platform are displayed here, such as:
- newly created users
- changes to campaigns
- system activities
This area helps you quickly understand what has happened recently in the system.
Campaign Overview
To the right, you will find an overview of your active campaigns:
- number of running campaigns
- list of the most recently edited campaigns
- quick access to individual campaigns
This allows you to see immediately which content is currently being delivered.
Monitoring and Hardware Status
The upper-right area displays the status of your infrastructure:
- online status of the hardware
- map view of locations and devices
- monitoring overview
This is especially relevant for operations, as it lets you quickly see whether all systems are reachable.
KPI Information
The lower area of the dashboard shows the most important key figures of your platform.
Top Campaigns
- ranking of the most successful campaigns
- number of active users per campaign
- click-through rate (CTR)
This is ideal for comparing the performance of individual campaigns directly.
User Statistics
- Passersby such as detected devices
- Visits
- Active users
These values give you an overview of how your locations and campaigns are being used.
This is comparable to the analytics functions in the existing documentation, where users, visitors, and passersby are distinguished.
Click-Through Rate (CTR)
- central metric for evaluating campaign performance
- percentage-based display including trend
It shows how effectively your content drives user interaction.
Filters and Time Periods
Above the KPI sections, you can set various filters:
- selection of one or more locations
- time period definition such as specific days or weeks
This allows analyses to be narrowed down and compared in a targeted way.
Role Within the Overall System
The dashboard is part of the central analysis and control functions of OCMP. According to the existing documentation, the platform is designed to create, manage, and analyze campaigns.
The dashboard combines this information in a compact overview and provides fast access to:
- campaign management
- location analytics
- monitoring
- reporting